
The charts and accompanying analysis below cover the period October 1st to 22nd 2021. As per recent posts, the information presented is either from the dashboard, or derived from dashboard data.

Between October 1st and 22nd, Barbados recorded 6,441 new cases (an average of 292 per day). The highest number of new cases, during this period, was recorded on Oct 21 (427). The lowest number recorded was on Oct 1 (183).


Between Oct 1 and 22, the total number of cases rose from 8,792 to 15,050. An increase of 6,258.


From October 6th, a new value for “In Home Isolation” was added to the dashboard. Chart 6 is the total number of persons in Isolation Facilities and in Home Isolation. At Oct 22 this stood at 4,700 persons.
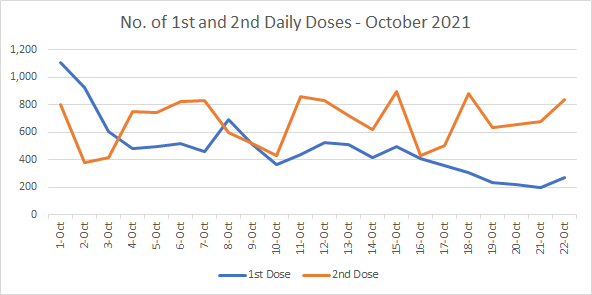
The average number of 1st doses and 2nd doses administered daily, between Oct 1 and 22, was 479 and 674 respectively. The largest number of 1st doses administered in a single day was on Oct 1 (1,104). The largest number of 2nd doses administered in a single day was on Oct 15 (897). The smallest amount of 1st doses occurred on Oct 21 (196), and the smallest amount of 2nd doses occurred on Oct 2 (377).


From October 5th, a new item called the “% Of Eligible Population Vaccinated” was added to the dashboard. This is defined as those persons who are 12 Years and Older. This % Eligible is higher than the % of Population. As at Oct 22, the % of Population Vaccinated is 44.5%, and the % of Eligible Population Fully Vaccinated is 52.9%

Between Oct 1 and 22, a total of 50 persons have died from Covid-19 in Barbados, or an average of 2.2 deaths per day.
Between October 18 and 22, there were 9 deaths (according to dashboard data). However, The Dashboard write-up does not appear to provide any break down on the deaths (i.e., gender, age, et cetera), or mention any deaths for that day (however, the total number of deaths is mentioned in the write-up).
Death information appears to be being published separately on the GIS website, but in at least one instance, the numbers do not add up. For example, on the Oct 22 dashboard image, 4 deaths were mentioned, but in the write-up below the dashboard image, there is no break down. A separate GIS post, titled ‘Two More Covid-19 Deaths On October 22,’ and published on Oct 23, which conflicts with Oct 22 dashboard data count of 4.